Cooling towers serve as the lungs of many industrial facilities, expelling waste heat to keep systems running smoothly. Yet, without precise data, operators essentially fly blind, risking inefficiency and equipment failure. Understanding how well your system operates is not just about keeping the water running; it is about optimizing energy use, conserving water, and extending equipment life.
This is where free cooling tower calculators prove their worth. These digital tools allow engineers and plant managers to quickly assess vital performance metrics without complex manual math.
In this blog post, we will explore what these calculators measure, why those metrics matter, and how you can use them to maintain peak system performance.
What Are Free Cooling Tower Calculators?
Free cooling tower calculators are accessible software tools designed to estimate the thermal performance and water balance of cooling systems. They take specific input data, like water flow rates and temperatures, and process them through standard engineering equations.
The result is a snapshot of how efficiently a tower rejects heat under current conditions.
- Estimate Critical Parameters: These tools calculate key metrics like cooling capacity, water consumption rates, and energy requirements simultaneously. While paid software is available for detailed design, free calculators provide a quick and reliable way to check daily operations.
- Used by Designers: They use these calculators for preliminary sizing of cooling systems.
- Used by Plant Operators: They rely on them for troubleshooting operational issues.
- Used by Maintenance Teams: They find them useful for verifying if cleaning or repairs have successfully restored performance to baseline levels.
Key Cooling Tower Performance Metrics You Must Understand
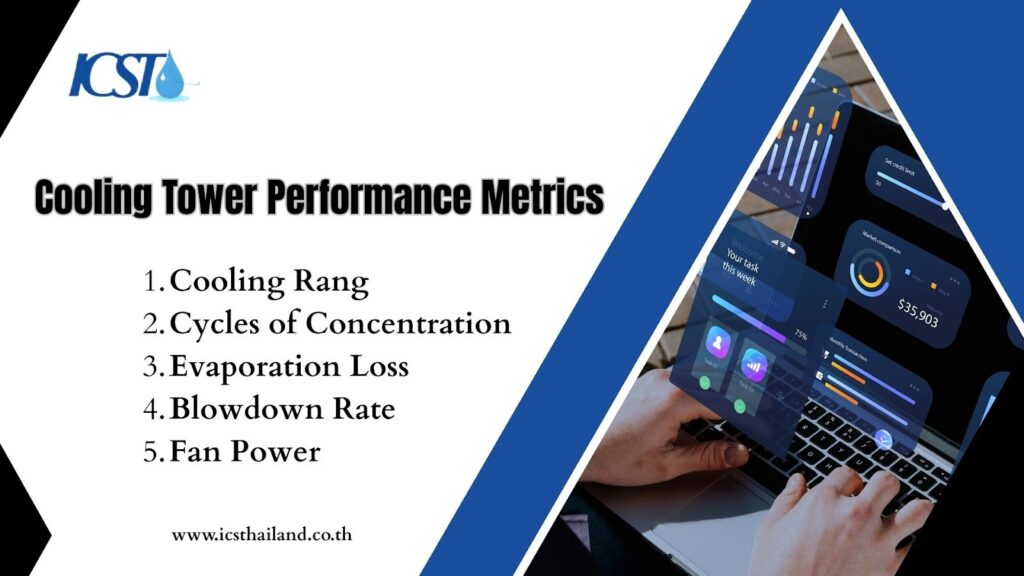
To use a calculator effectively, you must understand the language of cooling towers. The outputs are only as useful as your ability to interpret them. The following metrics form the foundation of thermal analysis.
Cooling Range | Measuring Heat Rejection Capability
The cooling range is the difference between the hot water entering the tower and the cold water leaving it. It represents the actual temperature drop achieved by the system.
- Determined by heat load: This value is dictated by the specific heat load of your facility.
- Weather-independent: If your process generates a consistent amount of heat, the range stays relatively constant regardless of outdoor conditions.
- Performance indicator: Monitoring the range confirms that the tower is successfully removing the required amount of heat from the process water.
Cycles of Concentration | Balancing Water Efficiency
Water contains dissolved minerals that do not evaporate. As pure water evaporates, these minerals remain and become concentrated. Cycles of concentration (COC) measure how many times the water circulates before the mineral content becomes too high.
- Operating at higher cycles reduces the need for makeup water, saving money.
- Pushing cycles too high can lead to scaling and corrosion risks.
- Calculators help operators balance water conservation with equipment protection.
Evaporation Loss | Understanding Where Water Is Consumed
Evaporation is the primary method of heat rejection in a cooling tower. For every pound of water evaporated, approximately 1,000 BTUs of heat leave the system.
Accurately estimating evaporation loss allows facility managers to predict water demand. Since evaporation rates fluctuate with the cooling load and ambient conditions, having a reliable calculation ensures the makeup water system is sized correctly.
Blowdown Rate | Controlling Water Quality
Blowdown is the intentional draining of water from the system to remove concentrated impurities. Without blowdown, dissolved solids would accumulate until they caused scale deposits on heat exchangers.
- Direct correlation: Blowdown rate is inextricably linked to evaporation loss and cycles of concentration.
- Cycle management: Increasing your cycles of concentration allows you to decrease the blowdown volume.
- Resource optimization: Calculating the precise rate maintains safe water quality levels while preventing unnecessary water waste.
Fan Power | Linking Energy Use to Cooling Performance
Fans move the air required to facilitate evaporation. The power they consume represents a significant portion of the tower’s operating cost.
Understanding the relationship between fan power and heat rejection helps in evaluating efficiency. If a tower requires maximum fan speed to achieve a modest cooling effect, it may indicate a problem with airflow or fill media. Calculating fan power helps identify opportunities for energy savings.
How Free Cooling Tower Calculators Work
These tools simplify complex thermodynamics into a user-friendly interface. To get accurate results, you must provide precise inputs. The calculator uses these inputs to solve mass and energy balance equations.
Most calculators require the following data points:
- Circulating water flow rate
- Hot water inlet temperature
- Cold water outlet temperature
- Ambient wet-bulb temperature
Once you enter this information, the software processes the thermal and water balance equations. It determines how much heat the water releases and how much air is necessary to absorb that heat. The outputs reveal whether the system is meeting its design specifications or falling short.
Step-by-Step Guide to Using Cooling Tower Calculators
Using free cooling tower calculators requires a systematic approach to data collection and entry. Follow these steps to ensure you generate actionable insights from the tool.

Collect Operating Data (temperatures, flow rates, ambient conditions)
Gather real-time data from your system’s gauges and sensors. Ensure you have the entering and leaving water temperatures, the circulation flow rate, and the current wet-bulb temperature. Accuracy at this stage prevents errors later.
Input Temperature Data to Calculate Range and Approach
Input your temperature data into the tool. The calculator will subtract the cold water temperature from the hot water temperature to find the range. It will then subtract the wet-bulb temperature from the cold water temperature to determine the approach.
Estimate Evaporation Loss and Water Balance
Enter the flow rate and range. The tool will apply standard factors (typically 0.00085 to 0.001 times the flow rate per degree of range) to estimate how much water is evaporating.
Determine Cycles of Concentration and Blowdown Rate
Input your target cycles based on your water treatment program. The calculator will use the evaporation rate to determine how much water you must bleed from the system to maintain those cycles.
Assess Fan Power Requirements
If the calculator includes energy metrics, input the airflow or fan motor details. This allows you to see the electrical cost associated with the current cooling load.
Interpret Results to Identify Performance Gaps
Compare the calculated outputs against the tower’s original design data sheet. Significant deviations suggest that components like the fill, drift eliminators, or distribution nozzles may need maintenance.
How to Interpret Calculator Results Correctly
Cooling tower calculators generate valuable numerical outputs, but those numbers only become useful when interpreted in the right operational context. Misreading performance data can lead to unnecessary maintenance, wasted energy, or overlooked system issues.
Instead of reacting to a single data point, focus on trends and relationships between key metrics. Comparing calculated results with design conditions and historical performance provides the most accurate picture of system health.
How to Spot Efficiency vs. Inefficiency
One of the clearest indicators of cooling tower efficiency is the approach—the difference between the cold water temperature and the ambient wet-bulb temperature. This value reflects how close the system is to its theoretical cooling limit.
- A well-performing cooling tower typically maintains an approach between 5°F and 7°F.
- If the approach begins to increase over time, it often signals reduced heat transfer efficiency.
- Common causes include fouled fill media, biological growth, scaling, or restricted airflow.
Tracking approach trends allows operators to detect early signs of performance degradation before they escalate into costly failures.
Understanding the Relationship Between Range and Approach
Range and approach must always be evaluated together. Looking at one without the other can produce misleading conclusions.
- A high range indicates significant heat rejection but may also result from reduced water flow rather than improved cooling.
- A low approach generally reflects good thermal performance, but achieving it may require increased fan power or higher energy consumption.
- If a tower maintains a low approach while fan energy rises sharply, this suggests mechanical inefficiency rather than improved performance.
Evaluating both values together ensures accurate diagnosis and prevents false assumptions about system health.
Limitations of Free Cooling Tower Calculators
While free cooling tower calculators are powerful, they are not infallible. Understanding their boundaries prevents reliance on inaccurate data.
Simplified assumptions used in free tools:
Most free tools use “rules of thumb” for evaporation constants and specific heat. They may not account for altitude adjustments, barometric pressure, or specific fan curve characteristics.
Scenarios where results may be less accurate:
Calculations become less reliable during extreme weather conditions or when the tower operates at partial load. The complex physics of air-water interaction at very low flow rates may not be fully captured by simple algorithms.
When advanced analysis or detailed modeling becomes necessary:
For critical applications or legal compliance, you need specialized engineering software. Comprehensive thermal modeling accounts for recirculation, interference, and precise fill geometry, which free tools cannot do.
Conclusion
Optimizing an industrial cooling system requires accurate data, not guesswork. Free cooling tower calculators simplify complex thermodynamic data, giving engineers the insights needed to enhance efficiency.
Key metrics like approach, range, cycles of concentration, evaporation loss, blowdown rate, and fan power should be monitored regularly to reduce costs and prevent downtime. Consistent tracking turns raw data into actionable strategies, ensuring long-term performance.
Don’t let inefficiency hurt your operations; start using these tools to monitor trends today. For any cooling tower maintenance needs or to purchase quality parts, trust ICST. Our expert team and reliable products are here to keep your system running smoothly. Contact us today to ensure your cooling tower operates at peak performance!
Frequently Asked Questions
What data is required to use a cooling tower calculator?
You primarily need the circulating water flow rate, the hot water return temperature, the cold water supply temperature, and the outdoor wet-bulb temperature.
What is the difference between approach and range?
Range is the temperature difference between the hot and cold water. The approach is the temperature difference between the cold water and the ambient wet-bulb temperature.
How do cycles of concentration affect blowdown rate?
Higher cycles of concentration reduce the blowdown rate. As you recirculate the water more times, you discharge less of it to waste, conserving water.
Can free calculators estimate fan power accurately?
They provide a good estimate based on standard fan laws. However, for precise electrical consumption, you should measure the actual motor amperage and voltage.
How often should cooling tower performance be calculated?
Ideally, operators should perform a quick check daily. A more detailed analysis should occur monthly or whenever seasons change significantly.