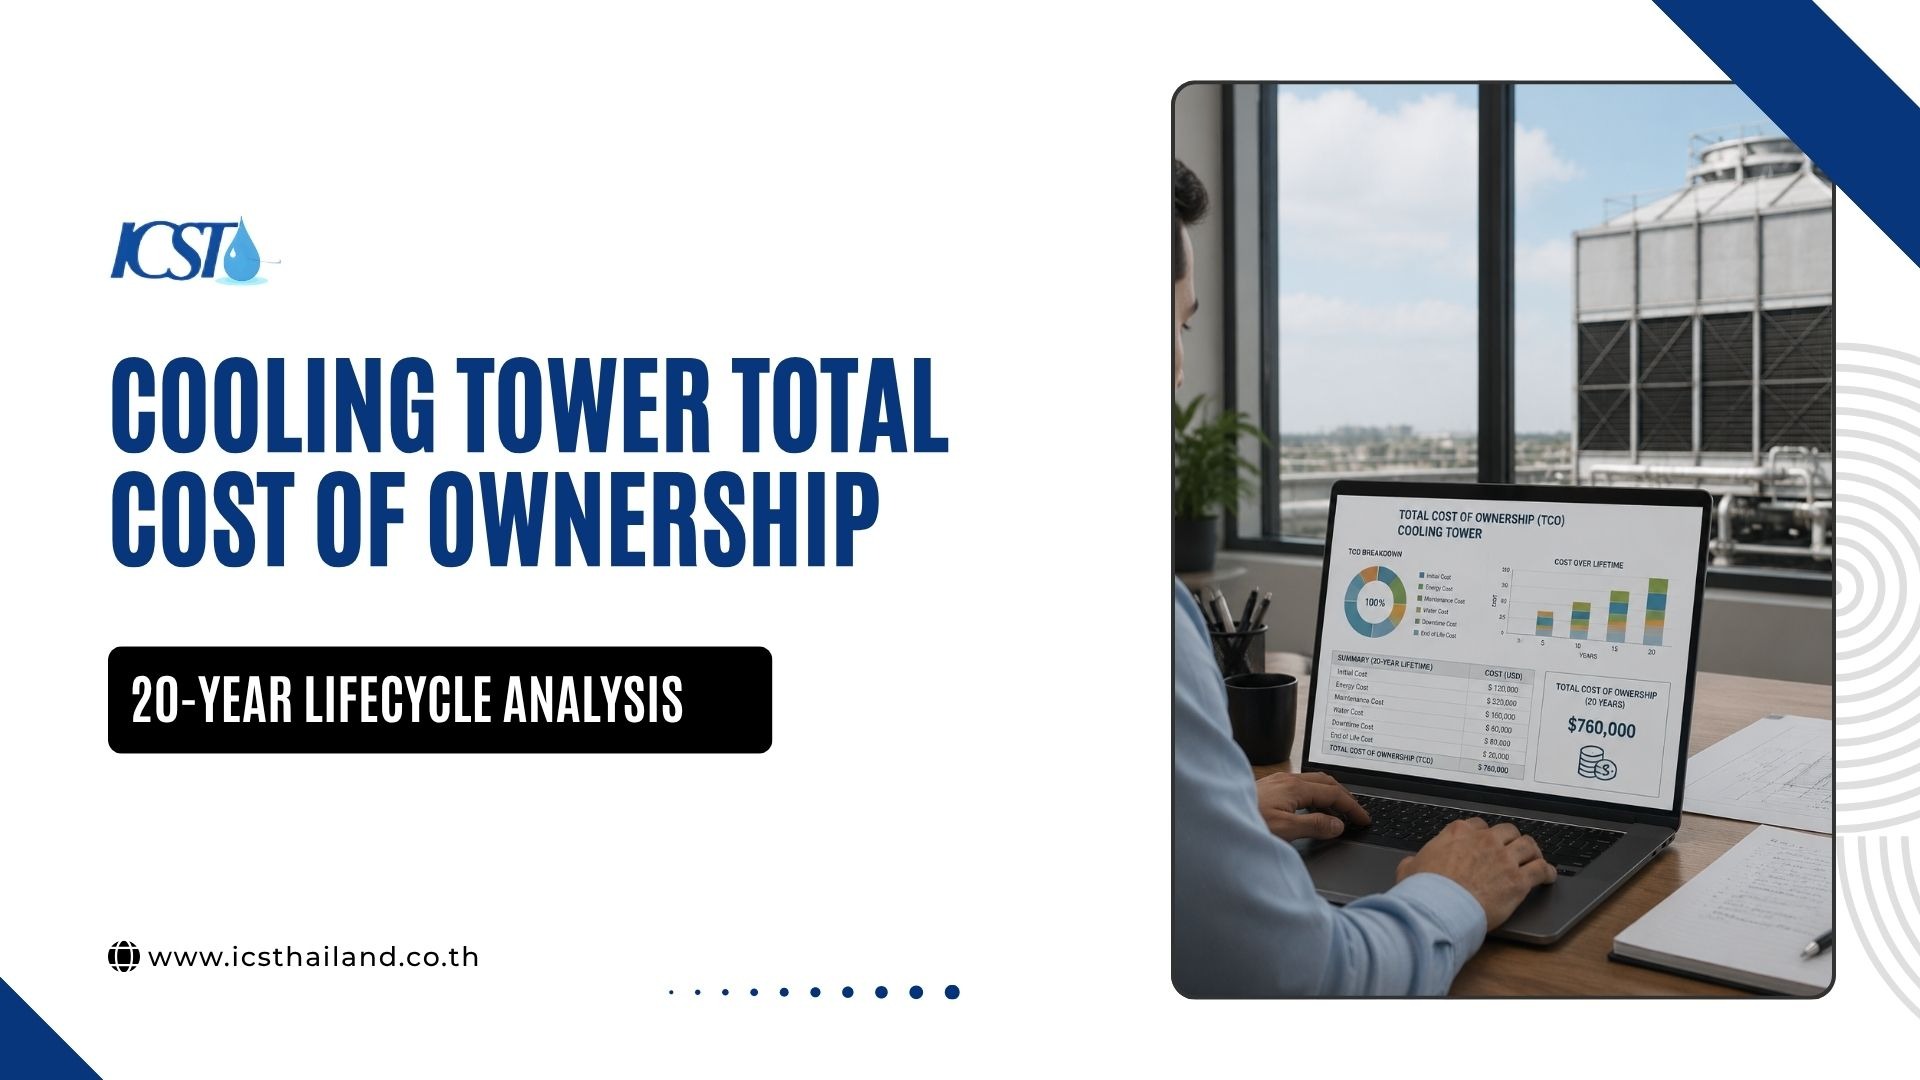
Cooling tower total cost of ownership measures the full 20-year lifecycle cost of owning, operating, maintaining, repairing, and replacing a cooling tower. A strong TCO analysis compares capital vs operating cost, including equipment, installation, energy cost, water, chemicals, inspections, parts, downtime, and disposal.
An NPV calculation converts future costs into today’s value, so plant managers and procurement teams in Thailand can choose the tower with the lowest long-term cost, not only the lowest purchase price.
Why Purchase Price Alone Creates Bad Cooling Tower Decisions
Many facilities make the same costly mistake: they compare cooling tower quotes by purchase price alone and sign with the cheapest bidder. This decision often leads to much higher expenses over the next 20 years.
A comprehensive cooling tower total cost of ownership analysis avoids this by revealing the true long-term financial impact, not just the initial price.
A 20-year financial view changes the picture. It helps engineers and CFOs see the real cost, not just the sticker price. This guide explains how to build a clear TCO analysis, how to use an NPV calculation, and how to compare cooling towers based on true lifecycle cost.
Here is the core idea before we go deeper:
- Cooling towers are long-life industrial assets.
- The purchase price is only one part of the cost.
- Operating cost can exceed the original capital cost over time.
- Poor design, weak materials, and skipped maintenance raise lifecycle cost.
- A proper TCO analysis helps you compare designs, vendors, materials, and replacement options.
What Is Cooling Tower Total Cost of Ownership?
Cooling tower total cost of ownership is the full financial cost of a cooling tower from purchase to end of life. It includes the initial capital cost and every future operating, maintenance, repair, energy cost, water, chemical, downtime, and replacement cost across the analysis period.
Think of it as the true price tag. The purchase order shows one number. The 20-year cost shows the real number.
TCO Analysis vs Purchase Price
Purchase price and lifecycle cost answer two different questions. The purchase price is just today’s cost. The cooling tower’s total cost of ownership shows the full cost over the asset’s life. Understanding the difference helps you avoid expensive mistakes.
- Purchase price: Shows what the buyer pays upfront, on day one.
- Total cost of ownership: Shows what the owner pays over 20 years.
- Cheaper tower risk: A low-cost tower may use more energy or need more repairs.
- Stronger tower value: A higher-cost tower may lower long-term risk and downtime.
Why 20 Years Is a Useful Analysis Period
A 20-year period captures the real operating pattern of many industrial cooling towers. It gives enough time to include maintenance cycles, fill media replacement, gearbox work, fan repairs, water treatment costs, structural repairs, and energy consumption.
A short one-year view often hides major repair events. A longer view helps teams compare repair, rebuild, upgrade, and replacement decisions with more fairness.
What Costs Should a Cooling Tower TCO Analysis Include?
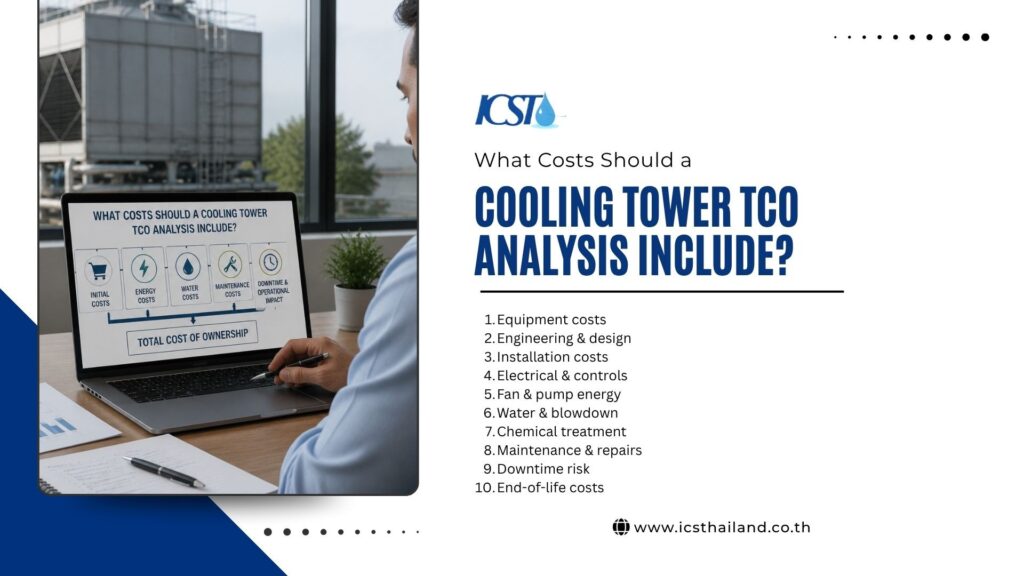
A useful TCO analysis includes every cost that changes because of the cooling tower decision. Leaving out energy, water, maintenance, or downtime can make the wrong option look cheaper. The goal is a complete cost model, not a partial one.
Include these cost categories:
- Equipment cost: Tower, fans, motors, fill, basin, structure, controls, and accessories.
- Engineering and design cost: Layout, structural review, thermal design, and electrical planning.
- Installation cost: Labor, lifting, access, foundations, piping, and commissioning.
- Electrical and controls cost: VFDs, panels, sensors, wiring, and automation.
- Fan and pump energy: Annual electricity for airflow and circulation.
- Water and blowdown: Makeup water, discharge, wastewater, and water loss.
- Chemical treatment: Biocide, scale control, corrosion control, and testing.
- Maintenance and repairs: Cleaning, inspections, spare parts, motors, gearboxes, and labor.
- Downtime risk: Lost production, emergency labor, temporary cooling, and restart cost.
- End-of-life cost: Disposal, demolition, replacement, and possible salvage value.
Wet cooling towers require ongoing maintenance and management to maintain performance, especially where fouling, corrosion, and spare parts affect operating cost.
Capital vs Operating Cost in Cooling Tower Decisions
When evaluating a cooling tower total cost of ownership, it’s important to consider both capital and operating costs. Capital cost refers to the initial purchase and installation, while operating cost covers ongoing expenses like energy, water, and maintenance.
| Factor | Capital Cost | Operating Cost | Procurement Focus | Why It Matters |
| Timing | Paid upfront | Paid every year | Controls the purchase decision | Long-term OPEX can exceed first cost |
| Examples | Equipment, installation, structure, electrical | Energy, water, chemicals, maintenance, repairs | Affects plant budget for 20 years | Both must sit inside the TCO model |
| Risk | Overpaying upfront once | Paying more every single year | Low CAPEX can hide high OPEX | Balance beats the lowest bid |
| Control | Set at project approval | Recurring and compounding | Easy to see, easy to overweight | Hidden costs grow over time |
| Best use | Compare project options | Compare lifecycle impact | Decide with full data | Use both inside the TCO analysis |
Why the Lowest Bid Can Become the Highest-Cost Tower
The cheapest quote often looks attractive on paper. In practice, low-cost towers often harbor hidden weaknesses that increase lifecycle costs year after year.
- Weak materials: Lower-grade materials corrode more quickly, shortening service life.
- Undersized design: A small tower may need more fan power or extra cells.
- Poor fill selection: Cheap fill reduces thermal efficiency.
- Weak water distribution: Uneven flow raises approach temperature.
- Poor access: Hard-to-reach parts increase maintenance labor.
- Cheap components: Low-quality parts fail earlier and cost more to replace.
A smaller or cheaper cooling tower may reduce initial capital cost but raise operating costs and efficiency losses over time.
Energy Cost: The Largest Hidden Lifecycle Cost

Energy cost often becomes one of the largest parts of cooling tower TCO, especially in large industrial systems in Thailand that run year-round. Fan power, pump power, controls, and thermal efficiency all shape electricity use.
Several design and condition factors drive that energy use. Understanding them helps you predict the real annual bill.
- Fan horsepower: Larger fans draw more power.
- Pump head: Higher head means higher pump energy.
- Water flow rate: More flow raises pumping cost.
- Airflow resistance: Blocked paths force fans to work harder.
- Fill media condition: Fouled fill drops heat transfer.
- Nozzle distribution: Poor spray patterns reduce efficiency.
- Drift eliminator pressure drop: Adds fan load.
- Approach temperature: Tighter approach demands more energy.
- Motor efficiency: Older motors waste power.
- Variable frequency drives: VFDs cut power at part load.
- Controls strategy: Smart controls reduce runtime.
Simple Fan Energy Cost Formula
A quick formula helps you estimate annual fan energy before deeper modeling:
Annual fan energy cost = Fan kW × operating hours × electricity rate
This gives a starting figure. A full calculation may need load profiles, VFD speed changes, multiple cells, seasonal operation, and local Thailand electricity tariffs.
Water, Chemical, and Blowdown Costs
Water-related costs can grow across a 20-year lifecycle cost model. These costs matter more when water prices rise, discharge limits tighten, or makeup water quality creates scaling and corrosion risk.
Cooling towers lose water through evaporation, drift, and blowdown. The system also needs chemical treatment to control scale, corrosion, and biological growth.
Include these cost items:
- Makeup water: Replaces water lost during operation.
- Evaporation loss: Normal but constant water use.
- Drift loss: Water carried out in the air stream.
- Blowdown: Bleed water removed to control concentration.
- Wastewater discharge: Cost to release treated water.
- Chemical treatment: Ongoing dosing program.
- Biocide: Controls biological growth.
- Scale and corrosion control: Protects metal and fill.
- Legionella risk management: Required for safety and compliance.
- Water testing: Regular lab and field checks.
- Filtration: Removes solids that foul the system.
- Cleaning and disinfection: Periodic deep cleaning.
Why Water Quality Changes TCO
Water quality affects every part of cooling tower ownership. Hard water can increase scale. Dirty water can foul fill, strainers, and nozzles. Poor treatment can increase corrosion. Biological growth can raise cleaning costs and health-risk controls.
Better water treatment does not only protect water quality. It reduces repair cost, performance loss, and emergency downtime.
Maintenance and Repair Costs Over 20 Years
A 20-year cooling tower TCO analysis must include predictable maintenance and likely replacement parts. Ignoring maintenance makes the model look artificially low and misleads the buyer.
Each tower type, material, water quality, and operating environment changes maintenance cost. The items below represent the typical work a tower needs across two decades.
- Annual inspection: Catches problems before they grow.
- Basin cleaning: Removes sludge and debris.
- Fill media inspection or replacement: A major mid-life event.
- Drift eliminator replacement: Restores efficiency and compliance.
- Nozzle cleaning or replacement: Keeps water distribution even.
- Bearing replacement: A common wear item.
- Structural repairs: Fix corrosion and fatigue.
- FRP member replacement: Restores structural strength.
- Louvers and platform repairs: Protect access and airflow.
- Coating or corrosion control: Extends metal life.
- Emergency repair allowance: A buffer for the unexpected.
NPV Calculation for Cooling Tower Lifecycle Cost
An NPV calculation converts future costs into today’s value using a discount rate. This helps procurement teams compare two tower options fairly over a long period.
A dollar spent ten years from now does not carry the same financial weight as a dollar spent today. NPV helps account for that difference.
ASHRAE life-cycle cost material explains that engineering economic analysis for HVAC and refrigeration systems uses present-value methods to compare costs over time.
Use this basic formula:
Present Value of Future Cost = Future Cost ÷ (1 + discount rate)^year
Then build the full picture:
20-Year TCO NPV = Initial Capital Cost + Present Value of all future annual costs + Present Value of major repairs and replacements − Present Value of salvage value
What Discount Rate Should You Use?
The discount rate shapes the result, so choose it carefully and apply it consistently. A few simple rules keep the comparison honest.
- Use your finance rate: Apply the company’s internal finance rate when available.
- Adjust for inflation: Some teams use a real discount rate adjusted for inflation.
- Stay consistent: Apply the same rate to every option you compare.
- Avoid bias: Do not change the rate to favor one vendor..
20-Year TCO Comparison: Low-Cost vs High-Efficiency Tower
The clearest way to see TCO in action is to compare two tower types side by side. This table shows how a low-cost tower and a high-efficiency tower differ across the factors that drive lifecycle cost.
Use it as a decision aid before procurement approval. The right choice depends on your operating hours, water quality, and uptime needs.
| Factor | Low-Cost Tower | High-Efficiency Tower | Best For | Expert Recommendation |
| Capital cost | Lower upfront price | Higher initial investment | Short-term budget control | Do not decide by CAPEX alone |
| Energy cost | More fan or pump energy | Lower energy with better design | High operating-hour sites | Model annual kWh over 20 years |
| Maintenance cost | Rises with weak components | Lower with better access | Sites needing strong uptime | Include preventive maintenance |
| Water treatment | Suffers from fouling | Stable, even operation | Hard or dirty water sites | Include water and chemical costs |
| Downtime risk | Higher with early failure | Lower with quality design | Critical process plants | Price downtime as a real cost |
| Lifecycle cost | Often higher over 20 years | Often lower when savings are real | Long-term asset owners | Use NPV before approval |
| Replacement timing | May need earlier rebuild | Longer life when maintained | Long-term asset planning | Compare service life, not price |
How ICST Can Help Lower Cooling Tower Total Cost of Ownership
ICST can support lifecycle cost planning by helping industrial facilities inspect existing cooling towers, compare repair vs replacement, improve thermal performance, select better parts, plan maintenance, and reduce avoidable energy, water, and downtime costs.
ICST support can include:
- Cooling tower inspections
- Cooling tower maintenance
- Thermal upgrades
- Cooling tower replacement
- Cooling tower parts
- Fill media replacement
- Fan, motor, gearbox, and drive support
- Disaster recovery planning
- Field support across Thailand and Asia
- Engineering and procurement support
This support helps plant teams connect financial analysis with real cooling tower conditions.
Summary
Cooling tower total cost of ownership gives a clearer financial picture than the purchase price. A proper TCO analysis includes capital cost, energy cost, water, chemicals, maintenance, repairs, downtime, and disposal.
A 20-year lifecycle cost model can change the procurement decision because energy, water, maintenance, and reliability often decide the real winner. An NPV calculation helps teams compare future costs fairly by converting them into today’s value.
Better design, better maintenance access, and planned upgrades can reduce long-term cost and improve reliability.
Frequently Asked Questions
What is cooling tower total cost of ownership?
Cooling tower total cost of ownership is the full cost of buying, installing, operating, maintaining, repairing, and replacing a cooling tower over its service life. It includes capital cost, energy cost, water, chemical treatment, inspections, parts, downtime, and disposal. A TCO view helps owners compare long-term value instead of choosing equipment only by the lowest upfront price.
How do you calculate cooling tower lifecycle cost?
Calculate cooling tower lifecycle cost by adding initial equipment and installation cost to future energy, water, chemicals, maintenance, repairs, downtime, replacement parts, and disposal. For a stronger financial model, discount future costs into today’s value with an NPV calculation and compare each tower option on the same timeline.
Why is energy cost important in cooling tower TCO analysis?
Energy cost matters because cooling tower fans, pumps, motors, and controls can run for thousands of hours each year. Poor airflow, fouled fill, high pump head, or inefficient fans can increase electricity use. Over 20 years, small efficiency differences can become a major part of total ownership cost.
What is the difference between capital cost and operating cost?
Capital cost is the upfront money spent on equipment, installation, engineering, structural work, electrical work, and controls. Operating cost is the recurring money spent on energy, water, chemical treatment, maintenance, repairs, inspections, and downtime. A low capital cost can look attractive, but high operating cost can make the tower more expensive over its full lifecycle.
How does NPV calculation help compare cooling tower options?
An NPV calculation converts future costs into today’s value using a discount rate. This helps teams compare two cooling tower options fairly over a long period, such as 20 years. NPV works well because maintenance, energy, repair, and replacement costs happen at different times.
When should a facility replace a cooling tower instead of repairing it?
A facility should consider replacement when the tower has repeated failures, serious structural damage, poor thermal performance, high energy or water cost, unavailable parts, or rising downtime risk.