Industrial cooling systems rely heavily on the smooth operation of large fans. When these components fail, the downtime is costly and disruptive. While physical symptoms like noise or shaking are obvious, the true health of the equipment is hidden within the data. By mastering fan blade vibration analysis, engineers can move from reactive repairs to a proactive reliability strategy.
This guide explores the technical side of vibration analysis. We will examine how frequency spectrum data reveals specific mechanical faults and how predictive maintenance strategies can stop catastrophic failures before they start.
From Symptoms to Data: Taking Fan Blade Vibration Analysis Further
In our previous guide on Industrial Fan Blade Vibration: Causes, Symptoms & Solutions, we covered the mechanical reasons behind vibration and practical corrective actions. That article explained why fans shake. This article goes deeper—into vibration frequency analysis, data interpretation, and predictive failure detection.
Instead of explaining what causes vibration generally, this guide explains how to interpret vibration data to identify the exact fault before catastrophic failure occurs. Understanding vibration frequency patterns allows engineers to move from reactive repairs to predictive maintenance.
What Is Fan Blade Vibration in Frequency Terms?
Fan blade vibration is not just random shaking; it produces identifiable frequency signatures. To analyze this, we must understand the fundamental units of measurement used in vibration analysis.
Vibration is an oscillatory motion measured in three primary ways:
- Velocity (mm/s or in/s): This is the most common metric for rotating machinery. It represents the speed at which the machine moves back and forth. Velocity is the best indicator of fatigue potential and overall machine health in the mid-frequency range.
- Acceleration (g): This measures the rate of change in velocity. It is particularly useful for detecting high-frequency issues, such as early bearing defects or gear mesh problems.
- Displacement (microns or mils): This measures the total distance the component moves. It is typically used for low-frequency vibrations, such as those found in very slow-speed fans or structural looseness.
Understanding the relationship between amplitude (severity) and frequency (cycles per minute or Hz) is critical. High amplitude at a specific frequency points to a specific mechanical culprit.
Understanding the Basics of Frequency Spectrum (FFT Analysis)
Raw vibration data appears as a time waveform—a complex, squiggly line representing movement over time. To make sense of this, analysts use the Fast Fourier Transform (FFT).
The FFT process mathematically converts the raw time waveform into a frequency spectrum. This spectrum separates the complex vibration signal into individual frequency components. Why is this superior to visual inspection?
Visual inspection only confirms that the fan is shaking. The frequency spectrum tells you what part is shaking.
For example:
- 1× RPM: A peak at the running speed of the fan usually indicates imbalance.
- Harmonics (2×, 3× RPM): Peaks at multiples of the running speed often suggest misalignment or looseness.
- Sidebands: Smaller peaks surrounding a central frequency can indicate modulation, often seen in gearbox or bearing faults.
Identifying Common Fan Blade Vibration Patterns in the Frequency Spectrum
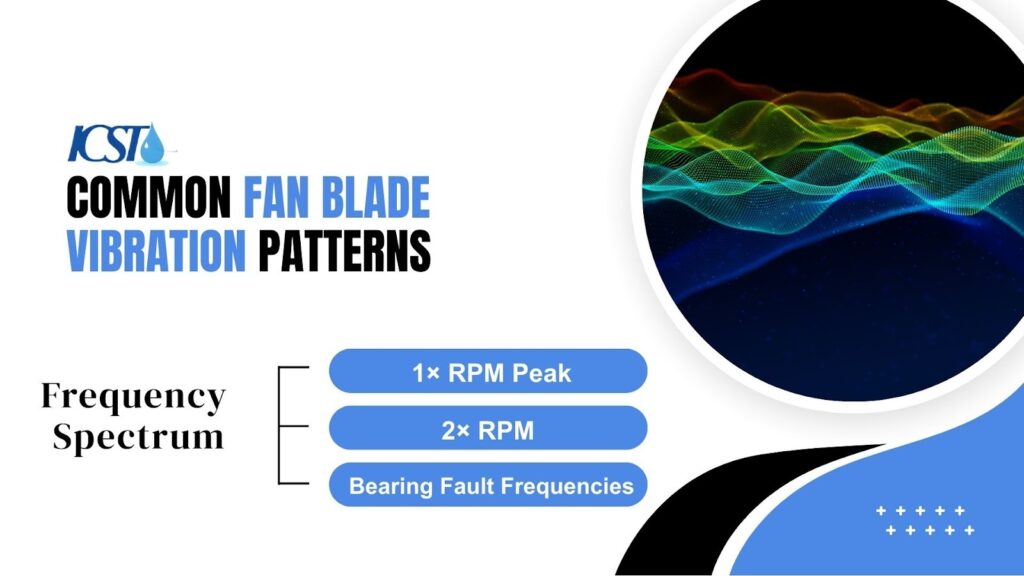
Different mechanical faults generate distinct fingerprints in the data. By analyzing the frequency spectrum, you can pinpoint the exact issue affecting the system.
📊 Industrial Fan Blade Vibration Analysis Table
| Vibration Pattern / Frequency | Typical Cause | Amplitude / Direction Notes | Recommended Preventive Action |
|---|---|---|---|
| 1× RPM Peak | Rotor imbalance | High radial amplitude; phase stable | Dynamic balancing, blade cleaning, inspect mass distribution |
| 2× RPM Peak | Shaft misalignment | Strong axial component; harmonics 1×, 2×, 3× | Shaft alignment correction, coupling check |
| 3× RPM / Higher Harmonics | Looseness or bent shaft | Combination of radial & axial peaks | Tighten hardware, structural reinforcement |
| Blade Pass Frequency (BPF) | Aerodynamic imbalance / airflow obstruction | Matches blade count × RPM | Inspect dampers, fan blades, airflow path |
| Bearing Fault Frequencies (BPFO, BPFI, Ball Spin) | Outer/inner race defects or rolling element wear | High-frequency “haystack” energy spikes | Bearing replacement, lubrication, envelope analysis trending |
| Sidebands / Modulation Patterns | Gear mesh issues, structural modulation | Peaks around carrier frequency | Inspect gear mesh, vibration isolation, torque check |
| Resonance Amplification | Structural natural frequency matches fan speed | Sudden amplitude spike, 90° phase shift | Change fan speed, reinforce support structure, detune natural frequency |
| Sudden Amplitude Spikes | Catastrophic event, blade crack, debris | All directions possible | Immediate shutdown, inspection, replacement |
| Slow Amplitude Growth | Gradual imbalance, dirt accumulation | Radial dominant, consistent trend | Scheduled cleaning, blade balancing, trending vibration over time |
| High-Frequency Floor Increase | Early bearing degradation | Rising high-frequency spectrum while low-frequency peaks stable | Predictive bearing maintenance, envelope analysis |
1× RPM Peak – Rotor Imbalance Signature
The most common source of fan blade vibration is rotor imbalance. In the spectrum, this appears as a strong, dominant peak exactly at the fan’s running speed (1× RPM). The phase reading will typically be stable. High radial vibration is a key characteristic here. If the amplitude at 1× RPM is high, the center of mass is not aligned with the center of rotation.
2× RPM – Shaft Misalignment Indicator
Misalignment between the motor and the fan shaft often generates a distinct pattern. You will see a significant peak at 2× RPM (twice the running speed). While imbalance is mostly radial, misalignment often shows a strong axial vibration spike. If the coupling is under stress, you may also see a combination of 1×, 2×, and 3× RPM harmonics.
Bearing Fault Frequencies
Bearings fail in predictable stages. Unlike imbalance, bearing faults do not usually align with exact integer multiples of the shaft speed. Instead, they appear at specific non-synchronous frequencies based on the bearing geometry. You should look for:
- BPFO (Ball Pass Frequency Outer Race)
- BPFI (Ball Pass Frequency Inner Race)
- Ball Spin Frequency
These often manifest as high-frequency energy spikes or “haystacks” in the spectrum before they become audible noise.
Blade Pass Frequency (BPF)
Blade pass frequency is calculated by multiplying the number of blades by the fan RPM. A strong peak at this frequency indicates aerodynamic issues. This could be caused by obstruction in the airflow, damper issues, or the fan operating too far from its best efficiency point. It is a flow-induced vibration signature rather than a mechanical defect.
Resonance Amplification
Resonance occurs when a forcing frequency (like the fan speed) matches the natural frequency of the structure. In the data, this looks like a sudden, massive amplitude spike that drops off quickly if the speed changes slightly. A 90-degree phase shift is often an indicator of resonance.
How to Perform Field Vibration Testing on Industrial Fans
Collecting accurate data requires precise sensor placement. If the accelerometer is mounted incorrectly, the data will be useless.
Sensor Placement Locations:
To get a complete picture of the machine’s health, measure vibration at the stiffest parts of the machine, closest to the bearings. Key locations include:
- Motor bearing housing: Drive end and non-drive end.
- Gearbox: Input and output shafts.
- Fan shaft: Pillow block bearings.
- Structural frame: To detect looseness or resonance.
Measurement Directions:
Vibration moves in three dimensions. You must measure in:
- Radial: Perpendicular to the shaft (horizontal and vertical).
- Axial: Parallel to the shaft (to detect misalignment).
Frequency Range:
Ensure your analyzer is set to the correct range. For general fan health, 0 to 1,000 Hz is often sufficient. However, for early bearing detection, you may need to extend the range to 0–10,000 Hz or utilize enveloping techniques.
Trending Fan Blade Vibration for Predictive Maintenance
A single vibration reading is a snapshot in time. It tells you the current condition but lacks context. To truly implement predictive maintenance, you must trend data over time.
Trending allows you to see the rate of change.
- Slow Amplitude Increase: This typically suggests a developing imbalance, perhaps due to dirt buildup on the blades.
- Sudden Spike: This indicates a structural issue, a lost balance weight, or a sudden failure event.
- High-Frequency Growth: If the high-frequency floor rises while the low-frequency peaks remain stable, it signals bearing degradation.
You should establish alarm thresholds based on standards like ISO 10816. These standards define vibration severity zones (Good, Satisfactory, Unsatisfactory, Unacceptable) based on the machine class and foundation type.
How Frequency Analysis Prevents Catastrophic Fan Failure
Routine frequency analysis not only prevents catastrophic fan failures but also adds significant value by optimizing the lifespan of your assets. By turning reactive maintenance into a proactive strategy, it ensures your fan systems run efficiently for years.
Here’s how frequency analysis helps prevent fan failures:
- Detects imbalance early to reduce bearing stress and extend its lifespan.
- Identifies misalignment to avoid premature coupling failure.
- Monitors blade pass frequency to optimize airflow and reduce aerodynamic stress.
When implemented effectively, frequency-based vibration analysis transforms maintenance into a strategic advantage, saving time and costs.
Advanced Technologies in Fan Blade Vibration Monitoring
The industry is moving beyond handheld analyzers toward continuous monitoring.
IoT and Wireless Systems:
New sensors can be permanently mounted to fans, transmitting data wirelessly to the cloud. This eliminates the safety risk of technicians climbing cooling towers to take manual readings.
SCADA Integration:
Vibration data can now be integrated directly into SCADA systems. This gives operators real-time visibility into asset health alongside temperature and pressure data.
Predictive Analytics:
Software utilizing machine learning can now analyze years of historical data to predict exactly when a specific component will fail, allowing ICST to plan outages with precision.
Common Mistakes in Interpreting Fan Vibration Data
Even experienced technicians can misinterpret data if they are not careful. Avoid these common pitfalls to ensure accurate diagnosis.
Confusing Imbalance with Misalignment:
Both can create vibration at 1× RPM. However, misalignment usually has a high axial component and a significant 2× RPM peak. Imbalance is almost exclusively radial.
Ignoring Phase Data:
Phase is the direction of the vibration. It is the most powerful tool for distinguishing between imbalance, misalignment, and a bent shaft.
Measuring Only One Direction:
If you only measure vertically, you might miss a horizontal looseness issue. Always measure in three axes.
Overlooking Structural Resonance:
If a fan vibrates excessively but balances perfectly on a shop floor, the issue is likely resonance in the field structure, not the fan itself.
When to Call a Professional Vibration Analysis Team
While basic vibration meters are useful for trending, complex analysis requires certification and experience. You should call a professional team if:
- Persistent 1× RPM Growth: You have cleaned the fan, but the vibration keeps returning.
- Structural Vibration: The frame is shaking more than the motor, indicating base issues.
- High-Frequency Bearing Signature: You see “haystacks” in the high-frequency spectrum, but cannot identify the specific fault frequency.
- Sudden Amplitude Spikes: The machine’s behavior changed overnight without a clear cause.
ICST offers certified vibration analysts, field balancing expertise, and laser alignment services to resolve these complex issues.
Final Thoughts
Fan blade vibration is not just a mechanical problem; it is a measurable signal. When properly analyzed, it becomes one of the most powerful tools for preventing catastrophic cooling tower failure.
By utilizing the frequency spectrum and tracking bearing fault frequencies, industrial facilities can ensure their cooling systems run efficiently and reliably. Do not wait for the shake to become a break.
Ready to implement advanced fan blade vibration monitoring? Contact ICST for professional vibration diagnostics and reliability solutions.
Frequently Asked Question
What is acceptable vibration level for industrial fans?
Acceptable levels depend on machine size and mounting. For most medium industrial fans, vibration velocity below about 4.5 mm/s RMS is generally acceptable. Always compare readings against the appropriate ISO severity class for the machine.
What does 1× RPM vibration mean in a fan?
A dominant 1× RPM peak usually indicates rotor imbalance. It is typically strongest in the radial direction and increases with speed. Dirt buildup or blade damage are common causes.
How can you tell the difference between imbalance and misalignment?
Imbalance mainly produces radial vibration at 1× RPM. Misalignment often shows strong axial vibration and a noticeable 2× RPM component. Phase analysis helps confirm the diagnosis.
What are bearing fault frequencies?
Bearing defects generate specific non-synchronous frequencies based on internal geometry. These often appear as high-frequency peaks or broadband energy in the spectrum. Early detection prevents sudden bearing failure.
What causes fan blade vibration in industrial systems?
Fan blade vibration occurs due to imbalance, misalignment, bearing wear, aerodynamic turbulence, loose mounting, structural resonance, debris accumulation, or material fatigue, reducing efficiency, increasing mechanical stress, and risking premature fan and motor failure.
How can fan blade vibration be minimized or prevented?
Fan blade vibration can be reduced through dynamic balancing, shaft alignment, vibration monitoring, aerodynamic optimization, lightweight composites, precision manufacturing, bearing maintenance, and predictive diagnostics, ensuring improved operational stability, energy efficiency, and extended industrial fan lifespan.