
Industrial cooling systems are complex beasts. They consist of pumps, heat exchangers, fans, and intricate control loops, all working in unison to dissipate heat. When one component fails, the entire system can grind to a halt, leading to costly downtime and potential equipment damage. Traditional troubleshooting often relies on ad-hoc checklists or the intuition of seasoned technicians, but these methods lack consistency and speed. A systematic approach is necessary to navigate this complexity effectively.
This is where a cooling system troubleshooting flowchart proves invaluable. By visualizing the diagnostic process, these charts transform chaotic symptom-chasing into a structured path toward a solution.
This guide will explore how to build and use these flowcharts to diagnose issues faster, reduce guesswork, and implement effective repairs. You will learn to move beyond simple fixes and identify the true root causes of failure.
Understanding Cooling System Troubleshooting
Effective maintenance requires tools that simplify decision-making under stress. Visual guides remove ambiguity and force a logical progression through potential faults.
What Is a Troubleshooting Flowchart?
A troubleshooting flowchart is a visual representation of the diagnostic process that guides a technician from a symptom to a solution. It uses logic to eliminate impossible causes and focus efforts on probable issues. Unlike static text manuals, cooling system troubleshooting flowchart methodologies streamline the thought process.
How does a flowchart improve the diagnostic experience?
- Definition and benefits: It is a logical diagram that promotes clarity, increases diagnosis speed, and ensures consistency across different shifts of technicians.
- Difference between text steps and decision trees: Text steps are linear and rigid, while decision trees branch out based on specific “Yes” or “No” answers to diagnostic questions, from wasting time checking irrelevant components.
Why Use a Symptom-Based Approach?
Starting with the symptom is the most practical way to diagnose a failure. It anchors the investigation in the observable reality of the machine.
- Reduces guesswork: Instead of dismantling parts at random, the technician focuses only on components related to the specific issue.
- Helps narrow down root causes quickly: By systematically eliminating possibilities through yes/no questions, the list of potential culprits shrinks rapidly.
- Improves maintenance response time: A direct path from “symptom” to “solution” means faster repairs and less downtime for the facility.
Core Components of a Cooling System Troubleshooting Flowchart
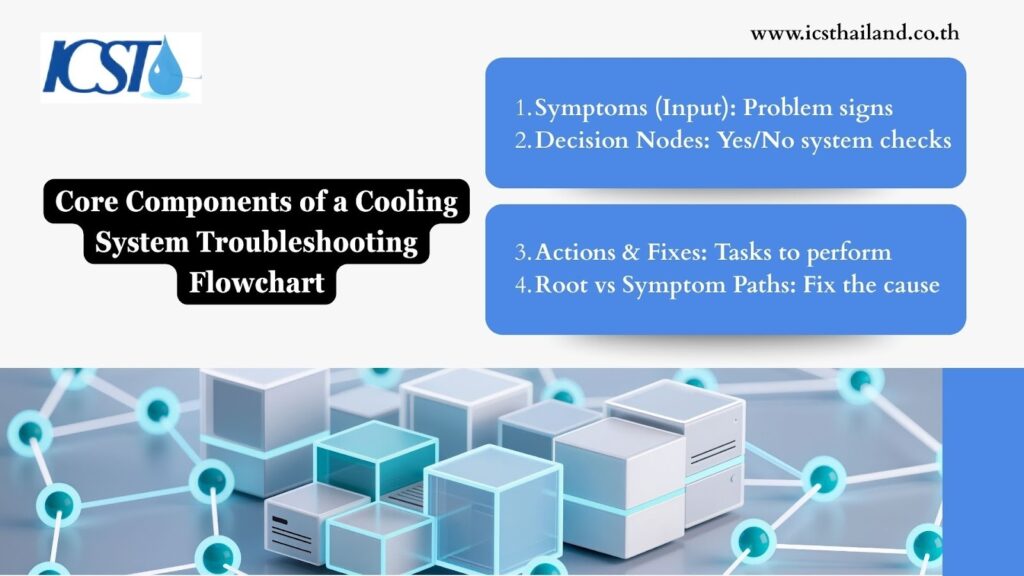
An effective flowchart relies on four main building blocks. Understanding these elements is crucial for creating a tool that actually works in the field.
- Symptoms (input): This is the starting point. It describes what is going wrong, such as “High Temperature Alarm” or “Excessive Vibration.”
- Decision nodes (Yes/No questions): These are the diamonds in the chart. They ask a specific question about the system’s state, such as “Is the pump running?” or “Is the filter clean?”
- Actions & quick fixes (output): These are the rectangles. They instruct the technician to perform a task, such as “Clean the strainer” or “Replace the fuse.”
- Root cause paths vs. symptom paths: A good chart distinguishes between treating the symptom (e.g., refilling coolant) and solving the root cause (e.g., finding the leak).
Step-by-Step Diagnosis: Common Cooling System Issues
This section breaks down typical failures using the logic of a cooling system troubleshooting flowchart. We will explore the decision paths that lead from a frustrating symptom to a concrete repair.
4.1 Cooling System Not Turning On
When a system fails to start, the issue usually lies within the electrical or control circuits. The goal is to trace the power from the source to the load.
Check the power supply:
Verify that the main breaker is on and that the unit is receiving the correct voltage. Use a multimeter to confirm that power is present at the disconnect switch.
Verify control signals:
Ensure the thermostat or PLC is actually calling for cooling. Is the setpoint lower than the current temperature? Is the control wire intact?
Possible Root Causes Identified
- Power failure: A blown fuse, tripped breaker, or utility outage.
- Control fault: A defective relay, failed PLC output, or broken sensor wire.
- Safety trip: A valid safety condition, like a low water level, has locked out the system.
Quick Fixes
- Reset breakers: If a breaker has tripped, reset it once. If it trips again immediately, investigate for a short circuit.
- Replace faulty sensors: If a temperature sensor reads incorrectly, it may prevent the system from starting. Swap it out.
- Clear safety lockouts: Identify which safety device triggered the lockout, resolve the condition, and manually reset the controller.
4.2 Poor Cooling Performance / High Outlet Temperature

The system runs, but it cannot keep up with the heat load. This usually points to a problem with flow or heat transfer efficiency.
Verify flow rates:
Is the coolant moving fast enough? Check flow meters or pressure gauges. Low flow reduces the ability to carry heat away.
Inspect heat exchangers:
Look for fouling on the coils or tubes. Dirt, dust, or scale acts as an insulator and prevents heat transfer.
Root Causes
- Blocked filters: Debris in the strainer restricts flow, starving the heat exchanger.
- Low refrigerant/coolant: Leaks reduce the working mass of the system, killing efficiency.
- Inefficient heat transfer surfaces: Scale buildup or biological growth (slime) on tube surfaces.
Quick Fixes
- Clean filters: Isolate the strainer, remove the basket, and wash out any debris. This is often the simplest fix for low flow.
- Rebalance flow: Adjust balancing valves to ensure the correct amount of fluid reaches each heat exchanger.
- Chemical cleaning of heat exchangers: Circulate a descaling solution to dissolve mineral deposits and restore heat transfer efficiency.
4.3 Excessive Vibration or Noise
Noise and vibration are early warning signs of mechanical failure. Ignoring them leads to a catastrophic breakdown.
Check fan belts/bearings:
Listen to the fan housing. A squeal usually indicates a slipping belt, while a grinding noise points to bearing failure.
Inspect pumps:
Cavitation sounds like pumping gravel. Check suction pressure to ensure the pump is not starving.
Review motor mounts:
Inspect the rubber isolation mounts under the motor and compressor. Are they cracked or collapsed?
Quick Fixes
- Tighten mounts: Use a torque wrench to ensure all mounting bolts are tight and secure.
- Replace worn bearings/belts: Do not wait for failure. If a bearing sounds rough, schedule a replacement immediately.
- Lubricate components: Grease bearings according to the manufacturer’s schedule. Over-greasing is just as bad as under-greasing.
4.4 Leaks or Fluid Loss
Fluid loss is an environmental hazard and a reliability issue. Finding the leak is the priority.
Inspect joints/seals:
Check all flanged connections, threaded fittings, and pump mechanical seals. Look for drips or dried residue.
Check cracks in piping:
Vibration can cause fatigue cracks in copper or PVC piping. Inspect stress points near pumps and valves.
Verify expansion tank pressure:
If the expansion tank loses its air charge, the relief valve may lift, dumping fluid.
Root Causes
- Seal degradation: Rubber O-rings and gaskets dry out and crack over time.
- Corrosion: Incompatible metals or aggressive water chemistry can eat through piping walls.
- Thermal expansion stress: Rapid temperature changes can cause pipes to expand and contract, loosening joints.
Quick Fixes
- Repair or replace corroded sections: Cut out the damaged section of pipe and install new material. Address water chemistry to prevent recurrence.
- Adjust pressure settings: Recharge the expansion tank air bladder to the correct pre-charge pressure.
Building the Cooling System Troubleshooting Flowchart
Creating your own chart requires a structured approach. You must map the territory before you can guide others through it.
How to structure a flowchart (start → decision point → path → action)
Begin at the top with the symptom. Draw a line to the first logical question. From there, create two branches: “Yes” and “No.” Each branch should lead to another question or an action. Keep the flow vertical, moving from top to bottom.
Symbol guide (terminal, process, decision, arrow)
- Oval (Terminal): Indicates the start and end points (e.g., “Start,” “Resolved”).
- Diamond (Decision): Represents a question with yes/no answers.
- Rectangle (Process): Represents an action step or operation.
- Arrow: Shows the direction of the process flow.
Example mini flowchart diagrams for critical issues
Imagine a “High Temp” path.
- Start: High Temp Alarm.
- Decision: Is the Pump Running?
- No: Go to “Electrical Check.”
- Yes: Go to next Decision.
- Decision: Is Flow Rate Normal?
- No: Check Strainer.
- Yes: Check Heat Exchanger Fouling.
Root Cause Identification Techniques
A troubleshooting guide is only as good as its ability to solve the underlying problem. While quick fixes get the system running, root cause identification ensures it stays running.
How to follow a decision path to the actual root cause?
Do not stop at the first finding. If a fuse is blown, that is a symptom. The root cause is why the fuse blew (e.g., a seized motor). Continue asking “why” at every step of the flowchart until you reach a fundamental issue that you can permanently correct.
Using data sensors to validate symptoms:
Human senses are fallible. Use data loggers to record temperature, pressure, and current over time. This data provides objective evidence to validate the symptoms and confirm that the fix actually worked.
Pattern recognition vs. random checks:
Randomly checking parts is inefficient. Look for patterns. Does the failure happen at a specific time of day? Does it correlate with another machine starting up? Flowcharts encourage pattern recognition by forcing a logical sequence of checks.
Case Study: Diagnosing a Circulation Failure
Let us look at a real-world application of step-by-step diagnosis.
The Scenario: A plastic injection molding facility experienced a “High Mold Temperature” alarm.
Step through the decision tree:
- The technician consults the cooling system flowchart.
- Symptom: High Temperature.
- Decision 1: Is the main circulation pump running? Answer: Yes.
- Decision 2: Is the supply pressure normal? Answer: Yes (60 PSI).
- Decision 3: Is the return pressure normal? Answer: No (Return pressure is 10 PSI, creating a massive differential).
- Logic: High differential pressure usually indicates a blockage.
Identify root cause:
The technician followed the “Blockage” path. They inspected the mold piping and found a collapsed hose liner that was restricting flow.
Apply fix:
They replaced the hose.
Before vs. after results:
Before the fix, the mold was overheating, causing product defects. After the fix, the pressure differential returned to normal (60 PSI supply / 45 PSI return), and product quality stabilized. The flowchart turned a potentially complex thermal issue into a simple plumbing fix.
Conclusion
The complexity of modern industrial equipment demands a structured approach to maintenance. A cooling system troubleshooting flowchart is more than just a diagram; it is a tool for efficiency, safety, and reliability. By guiding technicians from symptom to root cause, it eliminates guesswork and ensures consistent results.
Do not wait for the next breakdown to think about your diagnostic strategy. Start documenting your system’s logic today. Whether you use a simple hand-drawn chart or a digital decision tree, the shift from reactive scrambling to systematic diagnosis will transform your maintenance operations.
For expert support, quality cooling system services, or urgent maintenance, visit the ICST Website today to ensure your systems stay up and running.
Frequently Asked Questions
What is a cooling system troubleshooting flowchart?
It is a visual diagram that guides users through a logical sequence of yes/no questions to diagnose and repair cooling system failures.
Can digital tools or CMMS software help with troubleshooting?
Yes. Digital flowcharts integrated into CMMS systems allow real-time tracking, easy access for technicians, and analysis of the most frequent failure paths.
How can a flowchart help identify root causes?
By forcing a systematic elimination of variables, a flowchart prevents technicians from jumping to conclusions. It guides them past the obvious symptoms down to the underlying fundamental issues causing the failure.
Can I use this flowchart for any cooling system type?
While the specific components may vary (e.g., chillers vs. cooling towers), the fundamental logic of heat transfer remains the same. You can adapt the core structure of flow, pressure, and temperature checks to almost any industrial cooling application.