Cooling tower water loss occurs through three primary mechanisms: evaporation, drift, and blowdown. Evaporation is the largest source of loss and is essential for heat rejection, while drift carries water droplets out of the tower, and blowdown removes concentrated water to control dissolved solids.
Monitoring and calculating each type of loss helps facilities reduce makeup water consumption, lower chemical treatment costs, improve cooling tower efficiency, and prevent scaling or corrosion. Optimizing cycles of concentration, upgrading drift eliminators, and implementing automated water treatment are among the most effective ways to minimize cooling tower water loss without compromising system performance.
This guide breaks down exactly where cooling tower water consumption goes, how to calculate each type of loss using standard formulas from your cooling tower’s data sheet, and which strategies deliver measurable water conservation without compromising cooling efficiency.
Why Cooling Tower Water Loss Matters
Cooling tower water loss is one of the most overlooked line items in industrial operational costs. A tower that appears to be running under normal operations can still drain and waste thousands of liters a week through evaporation, drift, and blowdown, quietly driving up utility bills, makeup water demand, and water treatment chemical costs.
For facility managers, these hidden inefficiencies are easy to miss until they show up as a spike in the water bill or unexpected downtime.
How Cooling Towers Work
A cooling tower rejects heat by bringing warm water from the process or HVAC system into direct contact with ambient air. As the water evaporates, it absorbs heat from the remaining water and lowers its temperature before it’s recirculated back into the cooling system. This evaporation process is efficient and central to the cooling tower’s performance — but it’s also the primary mechanism behind water loss in cooling towers, alongside two secondary mechanisms: drift and blowdown.
Why Cooling Tower Water Consumption Matters
Tracking water loss isn’t just a sustainability metric; it directly affects operating cost and equipment life.
As water evaporates, the dissolved minerals and contaminants carried in the cooling water stay behind and concentrate in the remaining water. Left unmanaged, this concentration drives scale formation, reduces heat transfer efficiency, and leads to operational issues ranging from corrosion to premature equipment wear inside pipework and heat exchangers.
The standard control method is blowdown: periodically discharging a portion of the highly concentrated water and replacing it with fresh cooling tower makeup water.
This simple step keeps dissolved solids within a safe operating range and is a core part of any sustainable water management program that helps reduce operational costs, but it’s also a second, controllable source of loss that needs to be measured and optimized, not just left running on a fixed schedule.
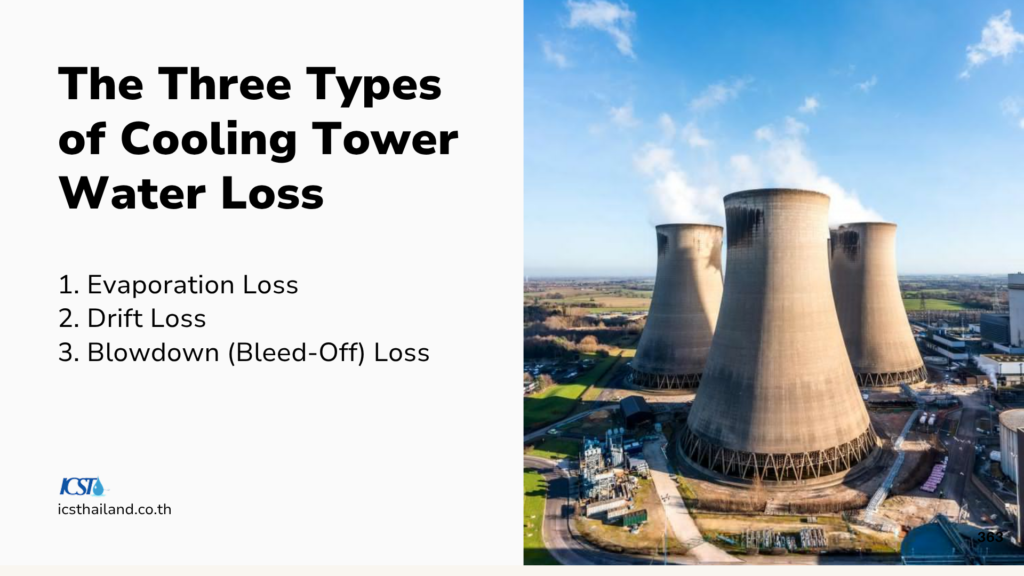
The Three Types of Cooling Tower Water Loss
Water loss in cooling towers happens through three mechanisms, each with a different cause, typical range, and optimization approach.
1. Evaporation Loss
Evaporation is the mechanism that actually produces cooling water absorbs heat from the system as it changes to water vapor. It’s unavoidable and, in most systems, intentional.
- How it happens: Heat energy converts a portion of the circulating water to water vapor, removing that heat from the system.
- Typical range: 70%–85% of total water loss in a cooling tower, varying with ambient temperature and humidity.
- Why it matters: Cooling tower evaporation loss also called evaporative loss, is the baseline you design around; it can’t be eliminated, only accounted for accurately in your water balance calculation.
2. Drift Loss
Drift is unevaporated water carried out of the tower as liquid water droplets in the exhaust air stream, effectively wasted water that performed no cooling function.
- How it happens: Worn or damaged drift eliminators, or units that are poorly designed for the application, fail to capture droplets before they exit with the airflow.
- Typical range: 0.1%–0.3% of circulating flow under normal conditions; damaged drift eliminators can push this significantly higher.
- Why it matters: Cooling tower drift loss looks small as a percentage, but because the droplets carry the same treatment chemicals and dissolved solids as the rest of the system, uncontrolled drift adds up in both water and chemical cost over a year of continuous operation and can create environmental or safety concerns if the droplets contain treatment chemicals.
3. Blowdown (Bleed-Off) Loss
Blowdown is the intentional discharge of concentrated recirculating water, effectively controlled wastewater used to control dissolved solids, minerals, and microbial buildup.
- Why it’s necessary: Without blowdown, dissolved solids climb until they exceed the system’s scaling and corrosion thresholds.
- Typical range: 10%–25% of total water loss, depending on the cycles of concentration (C.O.C.) — the ratio of dissolved solids in the system water versus the makeup water.
- Why it matters: Blowdown is the one loss mechanism you can directly tune. Raising the C.O.C. safely reduces blowdown volume and cuts both water and makeup water treatment chemical consumption.
How Do You Calculate Cooling Tower Water Loss? (Step-by-Step)
Accurately calculating water loss in cooling towers starts with a proper water balance calculation across all three mechanisms: evaporation, drift, and blowdown. Work through the three formulas below in order, using your tower’s flow rate, hot and cold water temperatures, and cycles of concentration.
Cooling Tower Water Balance: The Formulas
Accurately calculating water loss in cooling towers starts with a proper water balance calculation across all three mechanisms.
| Loss Type | Formula | Example Inputs | Result |
| Evaporation | 0.00085 × 1.8 × Flow Rate × (Th − Tc) | Flow = 12,000 m³/h, Th = 47°C, Tc = 36°C | 202.68 m³/h |
| Drift | Drift % × Flow Rate | Flow = 10,000 m³/h, Drift = 0.004% | 0.4 m³/h |
| Blowdown | Evaporation Loss ÷ (C.O.C. − 1) | Evaporation = 202.68 kg/h, C.O.C. = 4 | 67.56 kg/h (≈0.068 m³/h) |
Key: Th = hot water temperature (°C) · Tc = cold water temperature (°C) · C.O.C. = cycles of concentration
Worked Example: Evaporation Loss
For a tower circulating 12,000 m³/h with a 47°C hot-water and 36°C cold-water temperature:
0.00085 × 1.8 × 12,000 × (47 − 36) = 202.68 m³/h
That’s roughly 1.7% of total circulating flow lost to evaporation per hour under these conditions.
Worked Example: Drift Loss
For a tower circulating 10,000 m³/h with a manufacturer-rated drift value of 0.004%:
10,000 × 0.00004 = 0.4 m³/h
Worked Example: Blowdown Loss
With evaporation loss at 202.68 kg/h and a C.O.C. of 4:
202.68 ÷ (4 − 1) = 67.56 kg/h ≈ 0.068 m³/h
Total makeup water requirement = Evaporation + Drift + Blowdown. Tracking each component separately is what makes it possible to target the right fix — raising C.O.C. addresses blowdown, while upgrading eliminators addresses drift; neither improves evaporation, which is inherent to the cooling process.
Facilities working out a full water balance often also review their cooling tower water distribution at the same time, since uneven distribution across the fill can distort these readings.
How to Reduce Cooling Tower Water Loss
Evaporation loss is fixed by the physics of the cooling process. Drift and blowdown, however, respond well to targeted water conservation strategies.
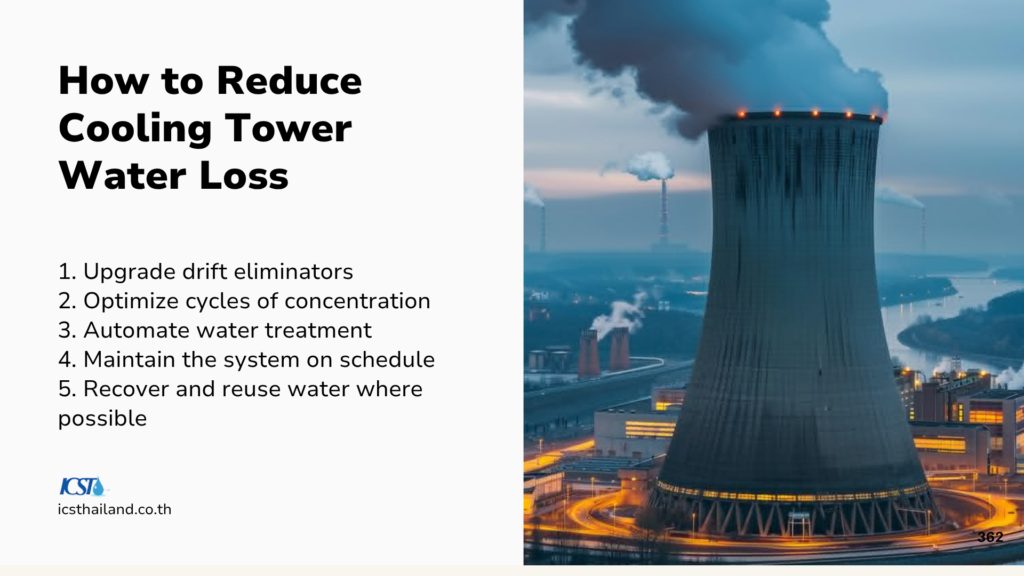
1. Upgrade drift eliminators. Modern eliminator designs can reduce drift to as low as 0.001% of circulating flow, cutting both water and treatment chemical loss.
2. Optimize cycles of concentration. Raising C.O.C., safely supported by regular water quality monitoring, chemical treatments, and real-time sensors, reduces blowdown volume and helps prevent scaling without increasing risk.
3. Automate water treatment. Automated dosing and monitoring systems adjust water treatment chemicals in real time based on actual water quality, preventing both over-treatment and scale-causing under-treatment.
4. Maintain the system on schedule. A single clogged nozzle, stuck valve, or fouled fill can spike water loss without any alarm being triggered. Regular maintenance, nozzle checks, fill inspection, and eliminator condition catches these issues before they escalate into measurable losses or unexpected downtime.
5. Recover and reuse water where possible. Treated greywater or reclaimed wastewater can serve as makeup water in many systems, reducing dependence on fresh water sourcing and the pumping energy that goes with it, supporting a more water-efficient, eco-friendly operation and broader industrial water usage reduction targets.
If drift and blowdown losses stay high even after maintenance, worn components are usually the underlying cause — a targeted cooling tower upgrade to the fill, eliminators, or fan assembly typically resolves this without needing a full unit replacement.
Case Study: Cutting Weekly Water Loss by 9,000 Gallons
A facility running outdated drift eliminators and a low cycles of concentration was losing 35,000 gallons of water per week.
Actions taken:
- Replaced worn drift eliminators with high-performance units
- Raised cycles of concentration from 2 to 4
- Installed automated water treatment monitoring
Result: Weekly water loss dropped to 26,000 gallons, a reduction of 9,000 gallons per week with an estimated $12,000 in annual cost savings. The improvement came entirely from addressing controllable losses (drift and blowdown); evaporation loss was unchanged, as expected.
Managing Water Loss in Tropical Operating Conditions
High ambient temperature and humidity increase cooling load and raise the risk of scaling, algae growth, and corrosion, all of which push blowdown and maintenance requirements higher. Counter-flow towers, where airflow moves opposite to water flow, generally maintain better thermal efficiency in these conditions and are a common design choice for tropical industrial sites.
Regardless of tower type, consistent water treatment and inspection schedules matter more in tropical climates, since fouling and biological growth progress faster in warm, humid air.
Conclusion
Understanding cooling tower water loss, including evaporation, drift, and blowdown, is essential for controlling operating costs and protecting equipment life. Evaporation can’t be reduced, but drift and blowdown respond well to proper maintenance, optimized cycles of concentration, and upgraded drift eliminators.
When a tower has degraded beyond what maintenance or an upgrade can fix, such as repeated fill collapse, structural corrosion, or persistent underperformance, a full cooling tower replacement is usually more cost-effective than continuing to patch an aging unit.
Reducing water loss starts with an accurate water balance audit of your system.
Frequently Asked Questions
How much water does a cooling tower lose?
Total loss depends on flow rate, temperature differential, and cycles of concentration, but evaporation typically accounts for 70–85% of the total, drift for 0.1–0.3%, and blowdown for 10–25%. A water balance calculation using your tower’s actual operating data gives an exact figure.
Why do cooling towers lose water?
Water is lost through three mechanisms: evaporation (intentional, produces the cooling effect), drift (unevaporated droplets escaping in the exhaust air), and blowdown (deliberate discharge to control dissolved solids and prevent scaling).
How to reduce water loss in cooling towers?
The two controllable losses, drift and blowdown, respond to upgraded drift eliminators, safely optimized cycles of concentration, automated water treatment monitoring, and routine maintenance. Evaporation loss cannot be reduced without reducing cooling capacity.
What causes water loss in cooling towers?
Evaporation from the heat-rejection process, drift from damaged or under-performing eliminators, and blowdown discharged to manage dissolved solids concentration are the three root causes.
What is the cooling tower water loss calculation formula?
Evaporation Loss = 0.00085 × 1.8 × Flow Rate × (Th − Tc). Drift Loss = Drift % × Flow Rate. Blowdown = Evaporation Loss ÷ (C.O.C. − 1). Total makeup water demand is the sum of all three.
1. Add FAQ Schema (JSON-LD) — paste in the page’s or via the SEO plugin’s custom schema field: 2. Add HowTo Schema (JSON-LD) — paste alongside the FAQ schema above: